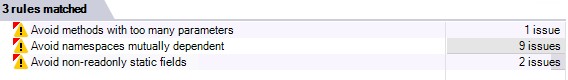
My last and first post

This is my last blog post in https://ladeak.wordpress.com. The site will be moved to https://blog.ladeak.net and the reader may expect further posts to be available at the new home.

WordPress has given a wonderful platform to get started with blogging, it provided custom templates, an editor, analytics and a free platform to host this site. As a developer I fancy creating my own place for the blog, hence the new blog is created.
The current site will not be removed, it will live along for a while; however new posts will be published only to the new blog.

I hope the reader will enjoy the new site just as much as the current.
Continue reading at: https://blog.ladeak.net

Using NDepend

In this post, I am going get started with a tool called NDepend. NDepend is a static analysis tool, for .net developers, which helps to understand different levels of dependencies in the code. It also provides code metrics, technical debt estimation etc, among many interesting features. I have been looking forward trying it, and in this post, I will have a first glance.

I have a chatbot application to help me with the public transportation waiting times. The core logic of this application has been moved to a class library, but it has been powering a Windows Mobile application, an ASP.Net Core website, a Service Fabric application and an Azure Functions app. Every time, I had hosted in a new platform, I had small changes and refactorings on the API, though there should be a good amount of tech debt piled up. Let’s see how NDepend can help me find these issues.

Getting Started

NDepend can be installed as a Visual Studio extension or as a standalone app. I have tried both versions. For iterative work, it is handy to have the tool installed as a VS extension, but otherwise, I prefer the standalone executable version of the tool.

Here is a typical workflow with NDepend:

  1. Open NDepend
  2. Open the solution (or folders with dll-s).
  3. Run the analysis
  4. Interpret results
  5. Refactor the code (run your tests)
  6. Repeat from the analysis step

In the next part of the post, I describe an itereation using this tool. First, open the solution in NDepend for analysis, and filter down the projects to a relavent subset for the investigation.

analyze

Unfortunately, the tool could not locate all the assemblies for the Service Fabric projects based on the solution file.

Interpreting (some of the) results

NDepend is an extremely in-depth tool. It provides several metrics and visualizations, hence the the user needs to have a good understanding of these metrics, before he/she can draw further conclusions about the code. As this is my first usage of the tool, I will pick one of the visualizations for this post but expect some further posts to cover some other metrics and views as well.

Fortunatly, there are several online videos to get started with the tool, but I found only one Pluralsight course which touches NDepend at the time of writing this post. Is this a great opportunity for content creators?

Let’s see the results of the first analysis:

dashboard

Ok, at first glance it says <5% of dept and a rating of A. I was expecting a little worse, though later looking at the rules, and suggestions I see plenty of opportunity to improve. The code has 2 Quality gate failures. Let's dig into these:

failedrules

It says Debt Rating per Namespace, not sure what this means, so let’s drill into by clicking it. The rule says:

Forbid namespaces with a poor Debt Rating equals to E or D. … The Debt Ratio of a code element is a percentage of Debt Amount (in floating man-days) compared to the estimated effort to develop the code element (also in floating man-days). The estimated effort to develop the code element is inferred from the code elements number of lines of code, and from the project Debt Settings parameters estimated number of man-days to develop 1000 logical lines of code. The logical lines of code corresponds to the number of debug breakpoints in a method and doesn’t depend on code formatting nor comments. The Quality Gate can be modified to match assemblies, types or methods with a poor Debt Rating, instead of matching namespaces.

Ok, so it says I just have too much dept here, let’s see the code. It consists of 2 classes with constant value declarations.

Refactoring the code

First Gate Failure

So, the first issues, is easy to solve. Some of the given types are not used at all. Fix is easy, simply removing them.

issues_deadmethod

In the second case, it suggests avoiding publicly visible constant fields. I was about to provide the reason for it here, why this is suggested, but the tool is kind enough to show it as well:

This rule warns about constant fields that are visible outside their parent assembly. Such field, when used from outside its parent assembly, has its constant value hard-coded into the client assembly. Hence, when changing the field’s value, it is mandatory to recompile all assemblies that consume the field, else the program will run with different constant values in-memory. Certainly in such situation bugs are lurking.

Again, simple change by lowering the scope of visibility, which I can do here easly, as these constants are specific to the chatbot only:

internal static class Inputs
{
    internal const string Choice = "ChoicePrompt";
    internal const string ChoiceMultiChannel = "ChoiceMultiChannelPrompt";
    internal const string Confirm = "ConfirmPrompt";
    internal const string Location = "LocationPrompt";
}

At this point, I built the source again, which also refreshed the NDepend analysis results: 1 quality gate less.

Second Gate Failure

The second quality gate says: Critical rule violations, let’s see what is inside.

criticalrules

There are three rules violated, let me address each of them, one-by-one.

Avoid methods with too many parameters: the rule identifies the constructors with more than 6 parameters and flags them. In this case I just hit the limit. I myself remember this method during implementation and thinking about creating a facade. Now the time has come to do it.

        public ScheduleBaseDialog(string name,
            ITravelRouteServiceFactory travelRouteServiceFactory,
            ConversationState conversationState,
            UserState userState,
            ISharedDialogService sharedDialogService,
            RequestLocationDialog requestLocationDialog,
            ILogger logger) : base(name)

In this case the subdialogs could be moved to a subdialog collection:

 public ScheduleBaseDialog(string name,
            ITravelRouteServiceFactory travelRouteServiceFactory,
            ConversationState conversationState,
            UserState userState,
            ScheduleSubDialogCollection scheduleSubDialogCollection,
            ILogger logger) : base(name)

Let’s run the analysis again, to confirm the violation is resolved.

The next rule on the list: Avoid non-readonly static fields: that was a simple change again. A missing readonly on a static field, which was initialized inline.

Finally, Avoid namespaces mutually dependent. Running into this rule meant cleaning up namespaces and moving classes to their proper namespace.
Fortunately in my case, I had the classes defined with clear dependency structure, but as they have been moved around to different folders with time, their namespaces did not match. Hence fixing the namespaces in this case was relatively simple. When an application has spaghetti code, this rule would be more involved to fix.

Running the analysis once more after addressing the issues shows debt has been reduced to half:

dashboardafter

As in each iteration NDepend compares results with the previous run, some additional quality gate violations might appear. For example changing public API will result a Critical rule violation. To disable this comparison, the user can select a baseline as none, which comes pretty handy. Note, that in this case public API violations were acceptable, as I am the only user of this codebase.

Conclusion

NDepend gives a nice summary on some of the tech debt hidden in projects, that have lived through multiple lifecycles of the code.

This is just getting started with NDepend. I am looking forward using it more-and-more in my daily routine. The reader of this blog may expect to see some further experience and hands-on tips in my future posts as well.

I would like to say thanks to NDepend for sponsoring this post by providing a license for their tool.

Missing Number Performance Tests

In this post I am going to look at the performance aspect for one of the tipical programming exercises on interviews.

Task usually goes by this:

Given an array with integers from 1 to N. The order of the integers is unknown. One of the randomly chosen number is replaced with 0. Create a method that receives the array as an input and returns the replaced number.

I am not going into the details of edge cases, input validation, error handling, etc. This post purely checks the performance aspects of some of the possible solutions. I also assume that N = x * 8.

Next, I will present three solutions:

  • A naive solution
  • One usually accepted solution
  • A fast solution

The naive solution

The naive solution that usually everyone starts with iterates over each possible number from 1 to N, and checks for each item if it is contained by the array.
Worst case we check N numbers, so contains might iterate over the array N times, each iteration comparing each item of the array results an O(N*N) operations.

public static int Contains(int[] items)
{
    for (int i = 1; i <= items.Length; i++)
        if (!items.Contains(i))
            return i;
    return -1;
}

Usually accepted solution

The second solution uses the fact that sum of numbers from 1 to N can be calculated with the following formula: (N+1)*N/2. Then we can sum up the items in the array and subtract it from the expected sum, which will give us the missing number. This time we only iterate over the array once, to sum up the integers, which is ends up O(N) operations. By definition this is faster on large enough arrays compared to the naive solution.

public static int Sum(int[] items)
{
    int expected = (items.Length + 1) * items.Length / 2;
    int sum = 0;
    foreach (var item in items)
        sum += item;
    return expected - sum;
}

Vectorizing

The last solution uses the same technique as the previous, but instead of summing items of the array one-by-one, we can use a faster solution. By vectorizing the items of the array and summing the vectors, we can leverage SIMD (Single Instruction Multiple Data) instructions to parallize the addition operations. The size of SIMD registers varies from machine to machine, in my case I have 8 integers in a Vector. This is still ends up O(N), as the number of operations depend linearly compared to the length of the input. In practise though, this results a faster solution to the previous one.

Note, that the below solution presented only work if the length of the array it a multiple of the number of integers a Vector can handle. If that is not the case, we would need to stop the while loop sooner while while(items.Length &gt;= Vector.Count), and we would need a final loop so sum up the last chunk of elements one-by-one.

public static int Vectorize(ReadOnlySpan<int> items)
{
    int expected = (items.Length + 1) * items.Length >> 1;
    var sum = Vector<int>.Zero;
    while (items.Length > 0)
    {
        sum += new Vector<int>(items);
        items = items.Slice(Vector<int>.Count);
    }
    return expected - Vector.Dot(sum, Vector<int>.One);
}

Benchmarks

For benchmarking, I used BenchmarkDotNet library, with one randomized integer array of length 8192 items. The table below shows that the naive solution is the slowest. Having the formula increases the preformance, several magnitude, and vectorization further boosts execution. As I mentioned earlier Vector holds 8 integers on my machine. So why do we see only ~5 times faster execution? The rest of the performance is used for the penalty of vectorizing the input.

|    Method |           Mean |        Error |       StdDev |
|---------- |---------------:|-------------:|-------------:|
|  Contains | 1,636,479.9 ns | 29,170.58 ns | 27,286.18 ns |
|       Sum |     4,774.7 ns |     95.53 ns |    137.01 ns |
| Vectorize |       991.7 ns |     19.56 ns |     31.59 ns |

Static Field Initialization in C#

The way static fields are initialized has been changed across .net framework version. As the framework matured, static fields have become initialized more lazily.

Today I will show a quick comparison between .net472 and .netcoreapp3.0 focused on static field initialization. I will use the following application to demonstrate the issue.

class Program
{
    static void Main(string[] args)
    {
        Console.WriteLine("Start");
        var test = new Test();
        test.DoWork();
        Console.WriteLine("Start work");
        test.DoWork2();
    }
}

public class Test
{
    private static readonly Logger logger = new Logger();
    public Test() => Console.WriteLine("TestCtr");
    public void DoWork() => Console.WriteLine("Working...");
    public void DoWork2()
    {
        Console.WriteLine("Working2...");
        logger.Log("Completing work");
    }
}

public class Logger
{
    public Logger() => Console.WriteLine("LoggerCtr");
    public void Log(string message) => Console.WriteLine(message);
}

As normally, someone using C# for a while you would expect static fields and class constructor (or static constructor) run and initialized before the first instance of a class being created and used. Now this is not entierly true, as we will see it in the following sections.

.net472 with Debug mode

Running the above application in .net472 with Debug mode, the previous statement still looks correct. The output of the application is:

Start
LoggerCtr
TestCtr
Working...
Start work
Working2...
Completing work

Before the Test class is being instanciated the Logger‘s class ctr runs, because Test class has a static field typed Logger.

.net472 with Release mode

Changing to Release mode might result the first unexpected behavior. You can instanciate and even invoke a method of a class, and the static field is still not initialized. See how Test class’s ctr., DoWork methods both executed before the static field got intialized.

Start
TestCtr
Working...
Start work
LoggerCtr
Working2...
Completing work

The static field variable initializers of a class correspond to a sequence of assignments that are executed in the textual order in which they appear in the class declaration. If a static constructor (Static constructors) exists in the class, execution of the static field initializers occurs immediately prior to executing that static constructor. Otherwise, the static field initializers are executed at an implementation-dependent time prior to the first use of a static field of that class.
Ref: Source

As there is no static constructor in the Test class, it is absolutely fine for the runtime to do the implementation-dependent time prior to the first use . This has been causing several production bugs and uncomprehending developers, not understanding why everything still looks correct when they debug their application.

netcore and Debug or Release mode

Fortunately, .net core fixes this issue of having different behavior in Debug and Release mode. I am testing with .net core 2.1. Running the same application now results a nearly similar output as the full framework in Release mode, though it is still different, resulting a 3rd behavior:

Start
TestCtr
Working...
Start work
Working2...
LoggerCtr
Completing work

In this configuration not only the Test class’s ctr., DoWork but even DoWork2 methods start execution before the static field gets initialized.
Although this seems a subtle difference, it can cause many production bugs and headaches, so it is better keep an eye on static fields. To overcome the behavior we can always add an empty static constructor, so that the static fields get initialized upfront too.

On the plus side, .net core works the same way in Debug and Release (at least on Windows platform), as well as code can be even step-by-step debugged through.

Null-coalescing Operator vs. Equals – Equals

Do you prefer to read on GitHub? Follow this link to read and comment.

I have been asked the following question over-and-over: which solution is the faster and better to use in the condition part of the if keyword, to branch based on a property which might be defined on a nullable reference type:
* to use the null-coalescing operator (??)
* or the equals operator (==)

To give some context let’s assume that we branch our code based on a reference type’s bool property:

public class SomeClass
{
    public bool Condition { get; set; }
}

We might not be sure if the reference type has a value. To express this in a nullable reference type semantics, we could say that we are testing against a property defined as:

public SomeClass? Instance { get; set; }

Benchmarkig the code

To perform a benchmark comparison, I use the BenchmarkDotNet library from NuGet.

I have two set of tests, one where the Instance property has an actual object assigned to its backing field, and one where it returns null.

The actual initial benchmark methods:

[Benchmark]
public int EqualsEquals()
{
    if (Instance?.Condition == true)
        return Param1;
    return Param2;
}

[Benchmark]
public int QuestionmarkQuestionmark()
{
    if (Instance?.Condition ?? false)
        return Param1;
    return Param2;
}

In the EqualsEquals method I am using a comparison with the == operator against true, so if the Instance is not null and the Condition property is true, Param1 is returned, otherwise Param2.

In the QuestionmarkQuestionmark method I am using the ?? operator and substitute the null case with false. When the Instance is not null and Condition property is true, Param1 is returned, otherwise Param2.

Both Param1 and Param2 are parameterized by BenchmarkDotNet [Params] attribute, to avoid hardcoded values and shortcuts by the compiler.
These tests also have a return value to avoid dangling code optimizations.

I am using .net core 2.2 to perform the benchmarks.

BenchmarkDotNet=v0.11.5, OS=Windows 10.0.17134.950 (1803/April2018Update/Redstone4), VM=Hyper-V
Intel Xeon CPU E5-2673 v3 2.40GHz, 1 CPU, 2 logical and 2 physical cores
.NET Core SDK=2.2.203
  [Host]     : .NET Core 2.2.4 (CoreCLR 4.6.27521.02, CoreFX 4.6.27521.01), 64bit RyuJIT
  DefaultJob : .NET Core 2.2.4 (CoreCLR 4.6.27521.02, CoreFX 4.6.27521.01), 64bit RyuJIT
Method Param1 Param2 Mean Error StdDev Median
EqualsEquals 18 12 0.0074 ns 0.0139 ns 0.0116 ns 0.0000 ns
QuestionmarkQuestionmark 18 12 0.0688 ns 0.0425 ns 0.0650 ns 0.0613 ns
EqualsEqualsNull 18 12 0.4651 ns 0.0533 ns 0.1065 ns 0.4506 ns
QuestionmarkQuestionmarkNull 18 12 0.4673 ns 0.0548 ns 0.1167 ns 0.4452 ns

MethodName suffixed with ‘Null’ indicates when the instance is null.

The initial benchmarks show significant difference in the case when the Instance property was not null. Comparison with the equals operator is significantly faster. Having a second look, we may notice that the Error column shows a larger value in case of the null-coalescing operator. Is this just some negligible difference caused by measurement errors?

Repeating the tests confirms that measurement errors may occur for the EqualsEquals testcase as well, having the results in opposite ratio. To mitigate the measurement error, I increase the test length with an iterator and scale the results with OperationsPerInvoke attribute:

[Benchmark(OperationsPerInvoke = 10000)]
public int QuestionmarkQuestionmark()
{
    int result = 0;
    for (int i = 0; i < 10000; i++)
    {
        if (Instance?.Condition ?? false)
            result = Param1;
        else
            result = Param2;
    }
    return result;
}

Repeating the benchmarks now show a more balanced result:

Method Param1 Param2 Mean Error StdDev
EqualsEquals 18 12 0.8224 ns 0.0162 ns 0.0373 ns
QuestionmarkQuestionmark 18 12 0.7757 ns 0.0150 ns 0.0220 ns
EqualsEqualsNull 18 12 0.8161 ns 0.0173 ns 0.0337 ns
QuestionmarkQuestionmarkNull 18 12 0.7992 ns 0.0160 ns 0.0323 ns

What is inside the box?

Are these solution equivalent? Do they produce the same IL and machine code? These are the questions I am answering in the following sections.

First, let’s compare the generated IL for both solutions.

The EqualsEquals method – without the for loop – has the following IL code. For the better understanding I add some description as comments after each line.

.method public hidebysig 
    instance int32 EqualsEquals () cil managed 
{
    // Method begins at RVA 0x226d
    // Code size 34 (0x22)
    .maxstack 8

    // SomeClass instance = this.Instance;
    IL_0000: ldarg.0 // Loads 'this' 
    IL_0001: call instance class IfNullTestBenchmark.SomeClass IfNullTestBenchmark.Program::get_Instance()
    // if (instance != null && instance.Condition)
    IL_0006: dup // Duplicates topmost value on the evaluation stack, at this point the value of Instance property
    IL_0007: brtrue.s IL_000d // If the value is not null, jumps to IL_000d

    // (no C# code)
    IL_0009: pop // If the value is null, pop the top of eval stack (Instance property)
    IL_000a: ldc.i4.0 // Pushes the integer value of 0 onto the evaluation stack 
    IL_000b: br.s IL_0012 // Jumps to IL_0012

    IL_000d: call instance bool IfNullTestBenchmark.SomeClass::get_Condition()

    IL_0012: brfalse.s IL_001b // Transfers control to a target instruction if value is false, a null reference, or zero. If the code jumped here from IL_000b, this condition will always be false, so it jumps ahead to IL_001b. Otherwise it branches based on the value of the Condition property.

    // return this.Param1;
    IL_0014: ldarg.0
    IL_0015: call instance int32 IfNullTestBenchmark.Program::get_Param1()
    // (no C# code)
    IL_001a: ret

    // return this.Param2;
    IL_001b: ldarg.0
    IL_001c: call instance int32 IfNullTestBenchmark.Program::get_Param2()
    // (no C# code)
    IL_0021: ret
} // end of method Program::EqualsEquals

Comparing this with the QuestionmarkQuestionmark, the only difference we may notice is the name of the method.

The final question I have, if there are any differences (optimizations) made by the JIT compiler to the above logic of the IL code. To check the machine code, I will use WinDBG with some inserted breakpoints, where I may examine the machine code.

  • Fire up WinDBG
  • Load SOS extension for the coreclr
  • Find the method in the method table with !name2ee command
  • Proint the Jitted code with !u
0:008> .loadby sos coreclr
0:008> !name2ee IfNullTestBenchmark!Program.EqualsEquals
Module:      00007ff99f674590
Assembly:    IfNullTestBenchmark.dll
Token:       000000000600001a
MethodDesc:  00007ff99f6755c8
Name:        IfNullTestBenchmark.Program.EqualsEquals()
JITTED Code Address: 00007ff99f791590
0:008> !U /d 00007ff99f791590

[path]\IfNullTestBenchmark\Program.cs @ 27:
>>> 00007ff9`9f791590 488b4108        mov     rax,qword ptr [rcx+8]
00007ff9`9f791594 4885c0          test    rax,rax
00007ff9`9f791597 740c            je      00007ff9`9f7915a5
00007ff9`9f791599 0fb64008        movzx   eax,byte ptr [rax+8]
00007ff9`9f79159d 85c0            test    eax,eax
00007ff9`9f79159f 7404            je      00007ff9`9f7915a5
00007ff9`9f7915a1 8b4110          mov     eax,dword ptr [rcx+10h]
00007ff9`9f7915a4 c3              ret
00007ff9`9f7915a5 8b4114          mov     eax,dword ptr [rcx+14h]
00007ff9`9f7915a8 c3              ret

Looking at the code, we may notice that the additional jump (when Instance was null in the IL code) has been optimized away, and the logic stands a lot closer to the logic of the C# method. It can be also confirmed that the QuestionmarkQuestionmark compiles exactly to the same code.

So are there any differences between the two approaches? It seems that the current C# compiler and RyuJIT compiles our code exactly to the same machine code, leaving us only with the textual difference in the source code.
So which one shall I use? I think it is up to the developer, whichever is easier to read and understand in the given context. I would choose the one which has a smaller mental weight in the given context.

An excellent TypeScript Book’s review

I have read a book about TypeScript for the past few weeks: Advanced TypeScript Programming Projects

This is an excellent book to get hands on experience with TypeScript. The author takes your through a series of projects, to show how one could use TypeScript instead of regular JavaScript. The very first chapter points out the benefits and additional features of TypeScript, then in each chapter we see a practical usage of it.

Throughout the projects we will see excellent examples for using OO design patterns such as Visitor, Chain of Responsibility, etc. A good point that the author also explains the details and implementation of these patterns. The code examples are nicely structured following the Single Responsibility Principal. Because of the many small types used, having the source code of the projects available on GitHub comes very handy to browse the code quickly.

The book shows how TypeScript may work along the most popular web frameworks such as React, Angular, Bootstrap, Material Design, Vue, WebSockets and ASP.NET Core. Having that many technologies might be a bit overwhelming if seeing them in the first time. Although the book does not go into the very details of these technologies, it points for further readings. I definitely recommend this book for a reader who has a minimum web development experience already, but also wants to get involved with TypeScript.

If you got interested, you can get the book on Amazon.

This is a non-sponsored post; I do not receive any commission or compensation for this post from the author nor the publisher.

String Interpolation in C# – $

String Interpolation has been introduced to C# with version 7. It is a really convenient way to express composite string expressions. As a language feature, you can use it independently to your .net version, which is great.

I have been using it for log messages, debug traces, chatbot responses, etc. It is easy to write, readable and usually comes very handy.

Under the hood, string interpolation is compiled into string.Format. The generated IL code shows the details.

public static void Test1(int a)
{
  var z = $"Data: {a}";
}

The method above is compiled into the the following IL.

box1

This looks good so far, but if take a look at it again, there is a really important think to note, argument ‘a’ is being boxed before passed string.Format method. This is clearly not the best for the performance, more objects using more memory, more work for the GC, and our heap allocation free algorithm loses the benefits (not including the allocation for the returned string). To avoid issues with boxing Console.WriteLine does have several overloads, so the compiler can use the most appropriate overload matching the type of the parameter to be written on the console window. Unfortunately string.Format does not have the same overloads.

String.Format is quite smart and using an internally cached StringBuilder and a ParamsArray struct under the hood to minimize allocations, but our int parameter triggers boxing before we get to the internals of string.Format.

StringBuilder

Is an alternative solution to use, it has the appropriate overloads that are missing on the string.Format, so we can avoid boxing, but unless we create a pool of StringBuilders, we will need allocate the StringBuilder itself (and its dependencies).

Comparison

The method above (Test1) allocates to objects, one because of boxing the integer and one for the string result. Both are collected as the method does not return either references.
2objects

Using a StringBuilder as an alternative, can save allocations. This comes handy, when we have multiple interpolated value types. In the case below we only allocate the object for the string on the heap.

public static void Test5(int a)
{
  b.Clear();
  b.Append("Data: ");
  b.Append(a);
  var z = b.ToString();
}

stringbuilder

Finally, even with StringBuilder we can end up with boxing, for example when we use custom value types. In this the compiler can only use the overload of Append method which takes an object parameter. This will result extra boxings:

customstruct

Conclusion

When using string interpolation with multiple interpolated values, we shall consider the consequences of boxing value types. As one alternative we can use StringBuilder to achieve the same result with a more performant code.

Mid-Life Crisis and Polly

Problem

I have been working on an application sending out millions of HTTP Post requests. The application has an issue, it has a high memory usage. It is using 2 GB over the expected of a few hundred megabytes.

An investigation revealed that a percentage of (random) requests are failing because of invalid request content. When a request fails, the application has a built in resiliency policy to wait with an exponential backoff and retry the failed requests. Unfortunately, that failed request is determined to fail again, hence triggering the above policy 3 times, before giving up for all.

One could figure, that the retry policy is referencing the failing requests for considerably longer period in memory. Let’s not trust our gusts but do some measurements instead.

Mid-life crisis is when an application does not behave according to the generational hypothesis (young objects die fast, old objects live even longer), young objects outlive Gen0, but as they reach Gen1 or Gen2 die there quickly.

Repro

To examine this behavior from a closer look, I created a sample service and client application. The service exposes a POST endpoint, and regardless of the response, it is using a random number generator to fail about 30% of the requests (this is a larger fail rate compared to the original use case, but required to compensate the smaller number of total requests). The client application sends out 1000 requests in a loop, each has a 2 ms delay after the previous request. Then the application awaits all the responses. Each request sends out an array of 65536 bytes that is large enough to have an impact, but small enough to be allocated on the small object heap.

I repeated the tests with the following different configurations:

  • resiliency policy
    • no retries
    • retry 3 times
    • wait and retry 3 times
  • requests’ memory
    • pooled
    • not pooled

Here are the Polly policies used within the tests:

registry.Add(WaitAndRetry3, Policy.HandleResult<HttpResponseMessage>(x => !x.IsSuccessStatusCode)
  .WaitAndRetryAsync(3, counter => TimeSpan.FromSeconds(2 << counter)));
registry.Add(Retry3, Policy.HandleResult<HttpResponseMessage>(x => !x.IsSuccessStatusCode)
  .RetryAsync(3));
registry.Add(NoOp, Policy.NoOpAsync<HttpResponseMessage>());

The output of the client app with no retry policy (failing about 30% of the requests):

Succeeded 698, 69.8%

The output of the client app with 3 retries (about 0.3^4*100=0.8% would fail):

Succeeded 994, 99.4%

Analysis

To measure the allocated memory and the application behavior, I used PerfView to sample allocations and garbage collection events.

The client application calls GC.Collect() before exiting, as the only induced GC. In the next sections I am showing and explaining the differences between the proposed configurations based on the PerfView sessions.

Not Pooled byte arrays – No Retries (Baseline)

private async Task<int> SendRequest(HttpClient client)
{
  byte[] data = new byte[65536];
  try
  {
    var response = await client.SendAsync(new HttpRequestMessage(HttpMethod.Post, _url) { Content = new ByteArrayContent(data) }, HttpCompletionOption.ResponseContentRead);
    return response.IsSuccessStatusCode ? 1 : 0;
  }
  catch (Exception)
  {
    return 0;
  }
}

In this use case the application allocates a new byte array for each request, and uses a NoOp retry policy, meaning that Polly will not retry, nor provide any resiliency to the requests.

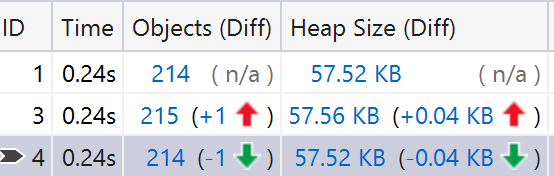
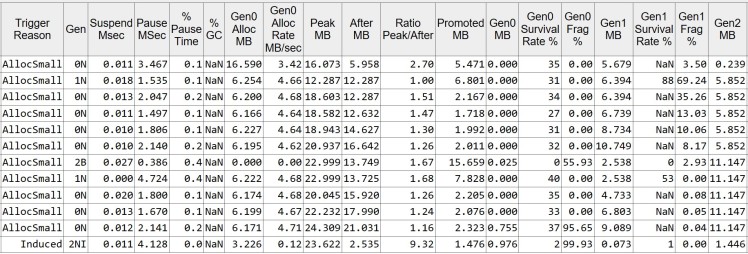
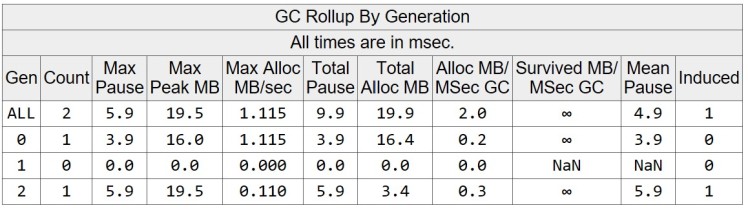
In this configuration the application allocates totally 73.529 MB and the max heap size is 16.053 MB, meaning most of the allocated memory ends up as garbage.

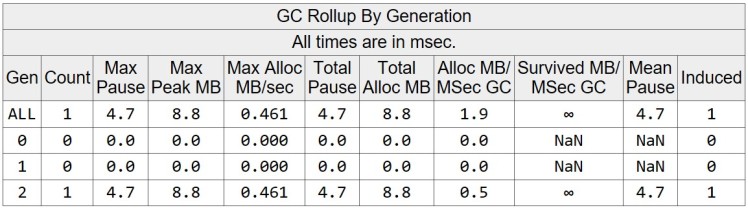
The GC runs 11 times, out of which the only Gen2 collection is the induced one, before application shuts down.

NoOpGC_new_summary

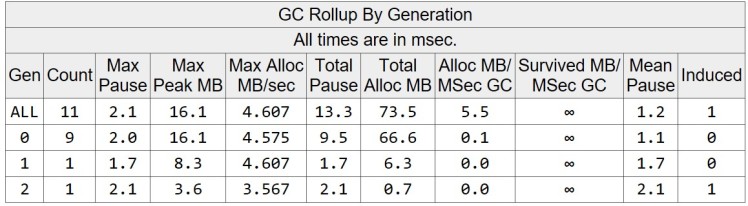
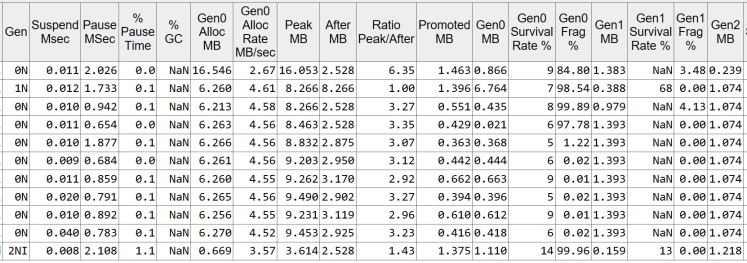
If we take a look at the individual GC events, we can observer that the size of Gen1 (Gen1 MB column) and Gen2 (Gen2 MB column) is relatively small when the GC finished. This is because most of the objects are allocated in Gen0 and most of them die very young. The Gen0’s survival rate is only a single digit, meaning most of the allocated memory is already garbage when the GC runs.

This behavior corresponds to the weak generational hypothesis.

NoOpGC_new_detailed

Not Pooled byte arrays – Retry 3 times

In this configuration the application allocates a new byte array for each request and uses a retry policy with the requests. It means if the request fails it tries to send the request again immediately, up until it has retried it 3 times.

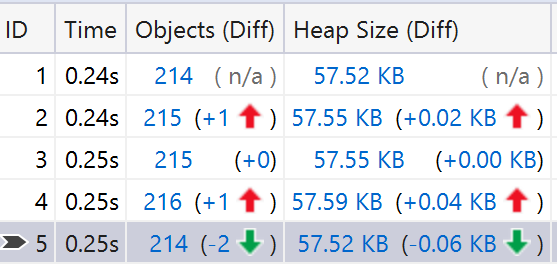
The total allocated memory is 75.090 MB while the max heap size is 16.025 MB. We have the same type and same number of GC events. Looking at the detailed events below, we can spot that the size of the heap (After MB) is slightly larger, as well as the Gen0 survival rate. I would not call this different significant at all, allocated objects are still short lived, and they die soon. A couple of requests that are retried might outlive the Gen0 collection.

Retry3_new_detailed

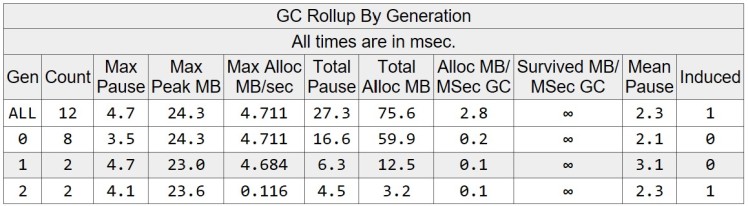
Not Pooled byte arrays – Wait and Retry 3 times

In this use case the application allocates a new byte array for each request, and uses a wait and retry policy with the requests. It means if the request fails, it waits a certain amount of time before it tries to send the request again.

The amount of wait time is determined by an exponential backoff policy, where the counter means the number of retries on the individual requests:

TimeSpan.FromSeconds(2 << counter)

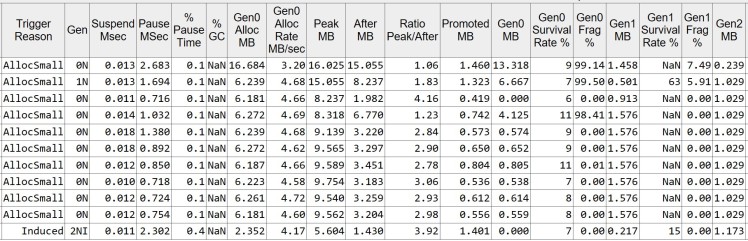
The total allocated memory is 75.623 MB while the max heap size is 24.309 MB. A careful reader can already spot that the total amount of allocated memory is about the same, while the max heap size increased significantly. If we observe the GC events, we can see that there is one additional Gen1 and Gen2 collection. That means that there are more objects getting promoted to higher generations.

WaR3_new_summary

Looking at the details, we can spot the increased size of Gen1 and Gen2.
This use case fits less well to the weak or strong generational hypothesis. Objects are still relatively short lived, though live long enough to be promoted into Gen1 and Gen2. This is caused by the exponential backoff policy. The heap size also grows throughout the lifetime of the application, except for final induced GC (when all requests have completed). After this full GC, most objects promoted to Gen1 and Gen2 become garbage and the size of the heap drops significantly. This indicates that most of these objects were experiencing a mid-life crisis.

WaR3_new_detailed

Note, that exponential backoff policy is a good behavior, we shall not replace it with simple retries to avoid mid-life crisis. Though it is important to know what consequences it might have on the application’s memory usage, as described above. One way to address this problem would be combining the WaitAndRetry with a CircuitBreaker policy.

Pooled byte arrays – No Retries

One might raise a question, what if we had pooled and reused the byte arrays for the requests. Instead of allocating a new array for each request, we can ask for a given size of memory from ArrayPool.Shared instance, and return the rented array once the request completes.

private async Task<int> SendRequest(HttpClient client)
{
  byte[] data = ArrayPool<byte>.Shared.Rent(65536);
  try
  {
    var response = await client.SendAsync(new HttpRequestMessage(HttpMethod.Post, _url) { Content = new ByteArrayContent(data) }, HttpCompletionOption.ResponseContentRead);
    return response.IsSuccessStatusCode ? 1 : 0;
  }
  catch (Exception)
  {
    return 0;
  }
  finally
  {
    ArrayPool<byte>.Shared.Return(data);
  }
}

In this use case the application uses an array pool to get a chunk of memory, (it could fill the requested memory with data) and send it to the server. Once a response is returned, the memory is returned to the pool. There is no resiliency enabled, if the request fails it will not be retried.

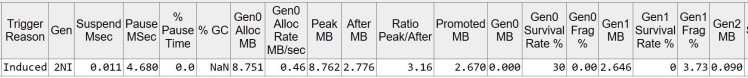
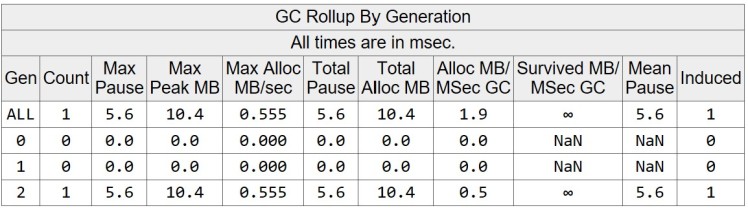
The total allocated memory is 8.751 MB and the max heap size measured is 8.762 MB. The GC is triggered only once by the application, which is the induced GC.

NoOpGC_pool_summary

The individual GC events table shows slightly more information about the heap. In this case a lot less memory is allocated compared to the non-pooled, non-resilient use case. This is because we can reuse existing arrays from the pool, in case any given two requests are not overlapping.

NoOpGC_pool_detailed

Pooled byte arrays – Retry 3 times

In this use case the application uses the same ArrayPool technique to rent a data array for the request, but it has a retry resiliency enabled, which will make the application retry failing requests. There is no wait time or backoff policy configured between the retries.

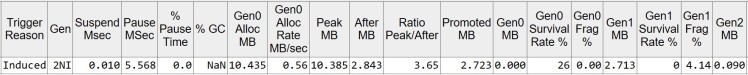
The total allocated memory is 10.435 MB and the max heap size is 10.385 MB. There is a single induced GC event before the application exits.

Retry3_pool_summary

In this use case we notice a similar behavior and comparison to the non-pool tests. The application uses slightly more memory, which is because some of the HTTP requests needs to be retried, hence these requests keep on to data rented data array for a longer time. It means more requests will end up running overlapped, so more byte arrays will be required from ArrayPool will result it allocating more pooled objects.

Retry3_pool_detailed

Pooled byte arrays – Wait and Retry 3 times

In this use case the application uses an ArrayPool to pool the byte arrays for the request, and it also waits with an exponential backoff policy if a request fails, before the retry.

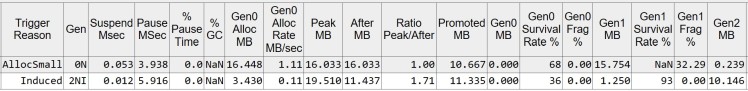
The total allocated memory is 19.878 MB and the max heap size is 19.510 MB. If we look at the GC events, there is a one triggered by AllocSmall and one induced before application exits.

WaR3_pool_summary

Looking at the individual events we may notice that most of the memory is promoted to higher generation and eventually to Gen2.

WaR3_pool_detailed

Final thought, the implementation of ArrayPool: TlsOverPerCoreLockedStacksArrayPool does have a trimming logic that may free up some of the unused pooled objects on a full garbage collection.

Summary

The tests above show examples on how a retry policy and memory management technique may have an effect on the application’s memory footprint. I find it useful to be aware of such behavior patterns, but nobody should deduce broad conclusions based on these. Every application is different, requests can be differently sized, numbered, their duration vary, that all may result significantly different generation sizes. As a general rule, always measure the application first.

Personality Chat Integration to Bots

There is a library and service called Personality Chat that can be integrated to a chat bot so add small talk capabilities. The interesting part of it is that you can provide a personality type like professional, friendly, humorous.

I have a LUIS chat bot, so it is an exciting option to me to integrate this capability to my bot. I have been using BotBuilder v4 SDK, and Personality Chat provides an integration point with that too. Integration itself seems simple, based on the provided samples and documentation, all you need is to setup a middleware for your bot during startup.

Tryout

The real story is a bit more involved, hence this post is born. The current status of the library is an alpha nuget package. It is referencing an alpha build of the BotBuilder v4 SDK too, which contains breaking changes. For this reason, you won’t be able to add middleware to your bot, you will get a compile error.

An alternative option is to create your own IMiddleware implementation, and use that instead of the one provided within the package. I tried this solution myself too, but soon I realized this is not a good route to follow.

Firstly, the service behind Personality Chat is throttled to 30 queries per minute, and I did not see an option to buy in for more quotas.

Secondly, the primary way my bot is used is not chit-chat. It is used with a reason, adding chitchat is just a nice touch. For this reason, having every chat message tested against the personality service is not a good option. Most of the messages won’t be chitchat, so it is just a waste of time and resources.

Thirdly, it is slow. According to my initial testing, it took about a second to get a response if the chat message has an adequate answer by the service, or I shall handle it by my bot. This hit is fine for a single message that I would not be able handle myself in the bot, but not for every message as part of a middleware.

A different route

For the above reasons I came up with a different solution. I added a new intent to my LUIS bot, called it ‘chitchat’. I opened up the data source of Personality Chat (it is available on GitHub), and added a couple of hundred sample questions to the intent’s sample. This way when some non-business chitchat message arrives, it would end up categorized to this intent.

Next, I modified my application. Added a handler to my new intent.

_dialogs.Add(new WaterfallDialog("chitchat", new[] { new WaterfallStep(GetChitChat) }));

All it does is invoking the service itself:

private async Task<DialogTurnResult> GetChitChat(WaterfallStepContext step, CancellationToken token)
{
  if (await _personalityChat.HandleChatAsync(step.Context, token))
    return await step.EndDialogAsync();
  await step.Context.SendActivityAsync("I am not sure if I can help with that.", "I am not sure if I can help with that.");
  return await step.EndDialogAsync();
}

To make it work I have a _personalityChat injected, which is a new type PersonalityChatInvoker, will be shown later. It has some extensions and registration during startup:

services.AddPersonalityChitChat(new PersonalityChatMiddlewareOptions(
botPersona: Microsoft.Bot.Builder.PersonalityChat.Core.PersonalityChatPersona.Professional, respondOnlyIfChat: true, scoreThreshold: 0.3F));

The AddPersonalityChitChat is an extension method:

public static IServiceCollection AddPersonalityChitChat(this IServiceCollection services, PersonalityChatMiddlewareOptions options)

  services.AddHttpClient();
  services.AddSingleton(options);
  services.AddSingleton<PersonalityChatInvoker>();
  return services;
}

It adds a HttpClient dependencies because the library internally uses HttpClient is a less efficient way. Adds the options and new class PersonalityChatInvoker. Let’s look at it:

public class PersonalityChatInvoker
{
  private readonly PersonalityChatService _service;
  private readonly PersonalityChatMiddlewareOptions _personalityChatMiddlewareOptions;

  public PersonalityChatInvoker(PersonalityChatMiddlewareOptions personalityChatMiddlewareOptions, IHttpClientFactory clientFactory)
  {
      //Initializing fields not included.
  }

  public async Task<bool> HandleChatAsync(ITurnContext context, CancellationToken cancellationToken = default)
  {
    IMessageActivity activity = context.Activity.AsMessageActivity();
    if (activity != null && !string.IsNullOrEmpty(activity.Text))
    {
      PersonalityChatResults personalityChatResults = await _service.QueryServiceAsync(activity.Text.Trim()).ConfigureAwait(false);
      if (!_personalityChatMiddlewareOptions.RespondOnlyIfChat || personalityChatResults.IsChatQuery)
      {
        return await PostPersonalityChatResponseToUser(context, GetResponse(personalityChatResults));
      }
    }
    return false;
  }

  private string GetResponse(PersonalityChatResults personalityChatResults)
  {
    List<PersonalityChatResults.Scenario> list = personalityChatResults?.ScenarioList;
    string result = string.Empty;
    if (list != null)
    {
      PersonalityChatResults.Scenario scenario = list.FirstOrDefault();
      if (scenario?.Responses != null && scenario.Score > _personalityChatMiddlewareOptions.ScoreThreshold && scenario.Responses.Count > 0)
      {
        int index = new Random().Next(scenario.Responses.Count);
        result = scenario.Responses[index];
      }
    }
    return result;
  }

  private async Task<bool> PostPersonalityChatResponseToUser(ITurnContext turnContext, string personalityChatResponse)
  {
    if (!string.IsNullOrEmpty(personalityChatResponse))
    {
      await turnContext
        .SendActivityAsync(personalityChatResponse, personalityChatResponse, InputHints.AcceptingInput)
        .ConfigureAwait(false);
      return true;
    }
    return false;
  }
}

In short it has similar responsibility as the middleware had: it invokes a service through PersonalityChatService, checks if the response’s score meets with the options, and returns the response message to the user if it is a hit for chitchat message. Note, that I am reusing the build in personas and MiddlewareOptions, from the original library.

Finally, let’s look at the PersonalityChatService:

public PersonalityChatService(PersonalityChatOptions personalityChatOptions, IHttpClientFactory clientFactory)
{
  _personalityChatOptions = personalityChatOptions ?? throw new ArgumentNullException(nameof(personalityChatOptions));
  _clientFactory = clientFactory ?? throw new ArgumentNullException(nameof(clientFactory));
}

public async Task<PersonalityChatResults> QueryServiceAsync(string query)
{
    HttpClient client = _clientFactory.CreateClient();
    client.DefaultRequestHeaders.Add("Ocp-Apim-Subscription-Key", _personalityChatOptions.SubscriptionKey);
    client.Timeout = TimeSpan.FromMilliseconds(5000.0);
    StringContent content = new StringContent(JsonConvert.SerializeObject(new PersonalityChatRequest(query, _personalityChatOptions.BotPersona)), Encoding.UTF8, "application/json");
    HttpResponseMessage response;
    using (response = await client.PostAsync(_uri, content))
    {
      response.EnsureSuccessStatusCode();
      var contentStream = await response.Content.ReadAsStreamAsync();
      using (var reader = new StreamReader(contentStream))
      {
        using (var textReader = new JsonTextReader(reader))
        {
          var serializer = new JsonSerializer();
          return serializer.Deserialize<PersonalityChatResults>(textReader);
        }
      }
    }
  }
}

The reason for this class is just to ensure that use HttpClient in a more correct way. Note, this is not production ready code yet, it is more of a suggested approach.

Summary

With this approach I can eliminate the disadvantages of the middleware, and still use personality as part of my LUIS bot.

Animating Graphs on Azure IoT DevKit

In the previous post I have shown how an image can be generated by an Azure Function and sent to IoT DevKit to display it.

In this post, I will show how that given image can be animated on the device.

The goal is to animate the graph from left to right, so it shows the measurements first closer to the y-axis, and the one further (to the right) only at a later time. I am not going to propose a generic animation algorithm, but rather an efficient and specific to this problem.

anim

Exploring options

Option 1: Create animation with Azure Function

Though it seems convenient to generate subsequent images in the Azure Function and sending them to the device, it requires a huge memory on the device (to buffer the images) and we would also send a lot more data to the device over the network. This results the function costing more (money), as it runs longer, as well as the device would probably need a clever way to handle messages as well as displaying them at the same time.

Because of these issues, this does not seem a viable solution for the above animation.

Option 2: Animation on the device

On the screen each row consists of 128 columns. A column is 8 pixels high represented by a single byte, where each bit represents a pixel of the column. A byte array represents the image to be drawn on the screen. When the byte array is 128*8 (the device has 8 rows) we draw a full screen image as the below figure shows below.

screen

In case we draw only to the half of the screen (halved vertically), we would need to put 64 bytes only to a row in the data array. When the given row is read (64 byte in this case) by Screen.draw a new row is started to be drawn from the continuation of the unread data in the array.

Zero out

The first idea might be to have the byte array, and zero out the bytes where we don’t want to draw yet. Zero-ing less-and-less columns will create the draw animation.
The problem with this solution is that we need to create a new large temporary array to copy the bytes over that we want to display. This solution could be optimized further.

Draw to

In the second solution, we could use the Screen.draw(x0, y0, x1, y1, data); to iteratively increment the x1 boundary value, from 1 until the end of the screen is reached.
The problem with this solution is that the shape of the data array (the length of a single row drawn) is very different from the previous iteration. The temporary array to be display would have a different size in every iteration. We need a new array allocation and a clever copy for this solution.

Final Solution

In order to find a more efficient solution, one idea could be to draw only a column at a time, which will result the animation effect. This is possible because the image is stable: previously drawn pixel do not need to be overwritten later in a single frame of the animation. The only difficulty is the undocumented behavior of Screen.draw function: it cannot start drawing on odd x0 column values.

With this limitation, we can draw two columns at a time. In my case, I need to draw 6 rows [2,8). This is represented by a fixed 12-byte long byte array. In an iteration from the 0th screen column to the one before the last, I populate this column array by copying over the bytes from the corresponding rows of the message. The process is shown on the figure below:

columns

The code for this solution can be found below. In order to have the animation effect, a small delay is added in each iteration.

static void ShowHistoricalDataAnimatedCallback(const char *msg, int msgLength)
{
  if (app_status != 6 || msg == NULL || msgLength != 6 * 128)
  {
    return;
  }
  Screen.clean();
  DrawTitle("Environment");
  unsigned char column[12];

  for (int i = 0; i < 127; i += 2)
  {
    for (int j = 0; j < 6; j++)
    {
      column[j * 2] = msg[128 * j + i];
      column[j * 2 + 1] = msg[128 * j + i + 1];
    }
    Screen.draw(i, 2, i + 2, 8, column);
    delay(10);
  }
}